
In the previous blog, we loaded apache log data into Elasticsearch with Logstash. Now our goal is to read this data into Kibana to help us run some analytics use cases. Quick note – the entire log file will not only be read into Elasticsearch but will also be displayed onto the standard output. It takes about 3-4 minutes to display the entire log file. ( remove “ignore_older => 0” from the config file to read older logs). To cross check if the data has been loaded and indices have been created in Elasticsearch, type the following in the browser http://localhost:9200/_cat/indices ( replace “localhost” by the server name that Elasticsearch is running on). This will show all the indexes created, logstash will create indexes that start as logstash-*. Once you find logstash indexes, its time to get them into Kibana.
Kibana accesses Elasticsearch indices using “index patterns”. We specify the pattern of the index name we are searching for, and create an index pattern for Kibana to fetch the data from Elasticsearch. If the difference between index name and index pattern is not immediately clear, please wait till we create index patterns in Kibana.
Log into Kibana from browser using http://localhost:5601/ (replace “localhost” by IP/name of the server Kibana is running on). Kibana home page will open up, if it doesn’t please check that Elasticsearch and Kibana are up and running on the server. In case you need to troubleshoot, please check the earlier post on troubleshooting kibana.
From Kibana home page (left side Menu), click on “Management->Index Patterns-> “+Create Index Pattern button. The following page opens up
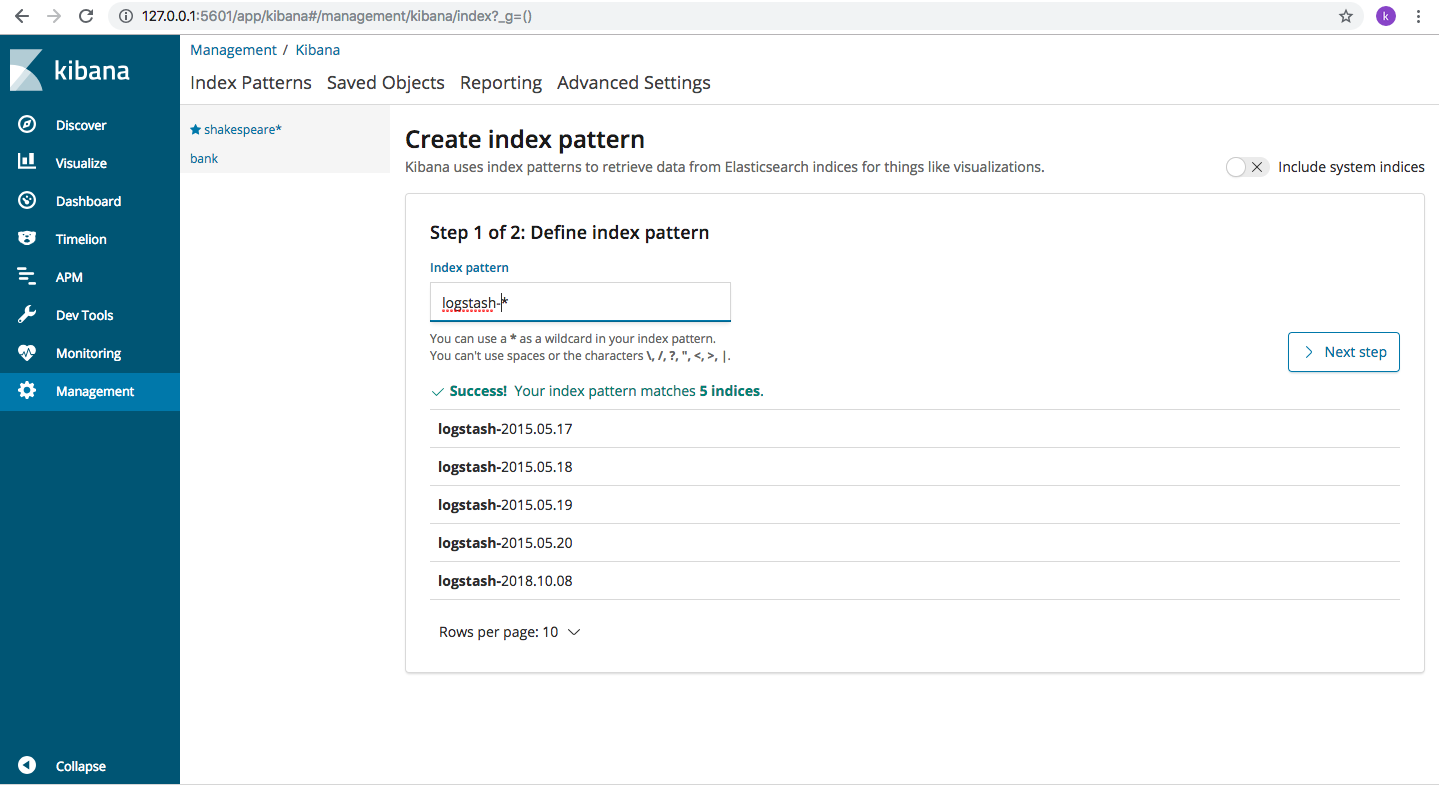
In the Index Patterns field, type “logstash-*” and Kibana will display all the indexes in Elasticsearch whose name matches the given pattern. Click on “next” and choose “@timestamp” so we can filter our data by time.
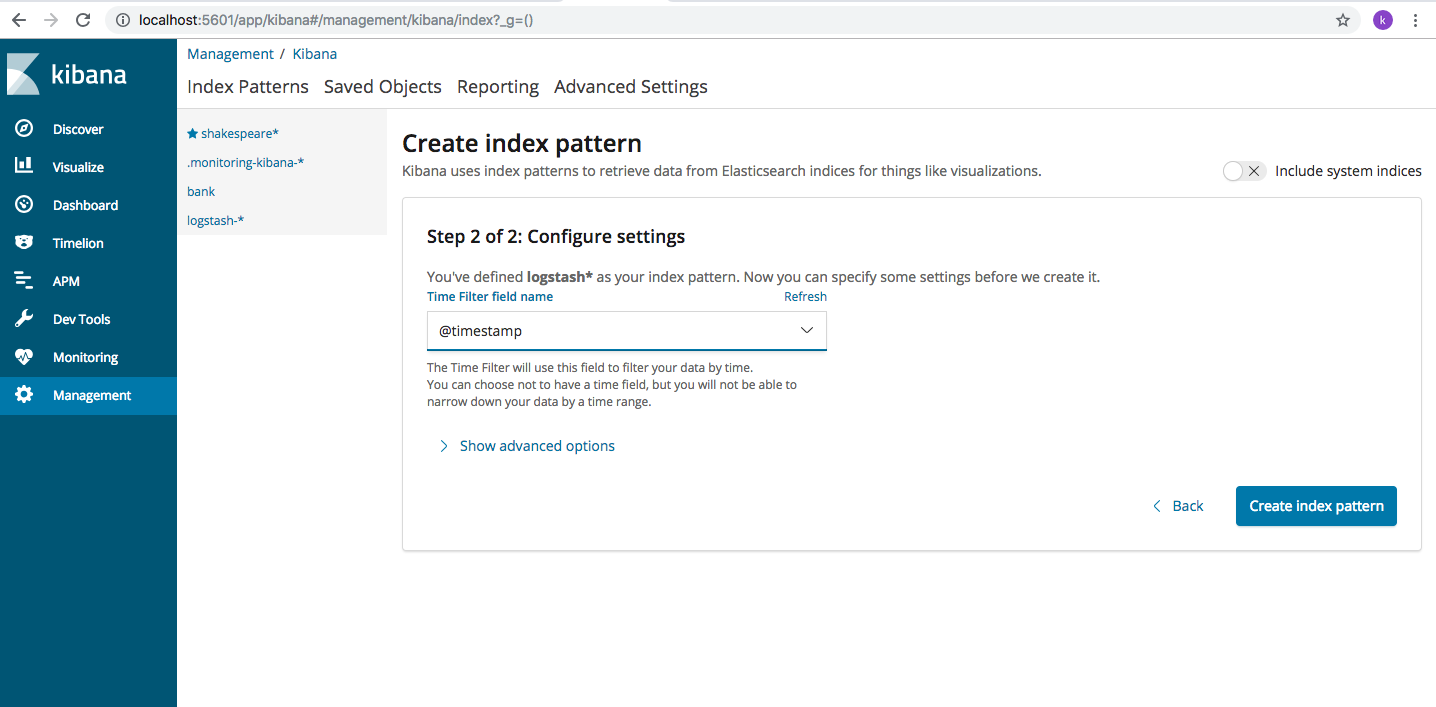
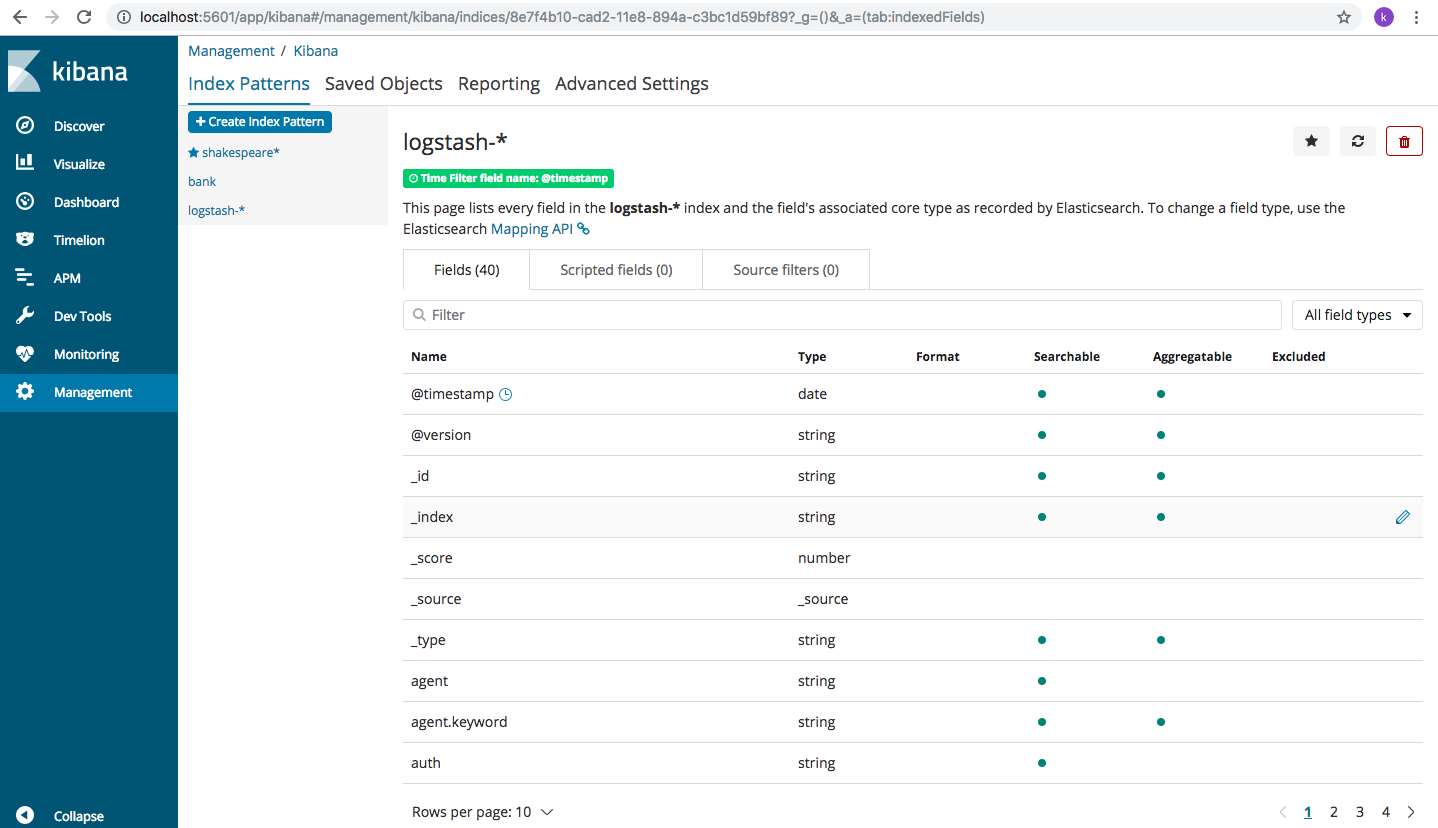
Click on “Create index pattern” button and an index pattern will be created with all the fields being displayed
With index pattern created, we are ready to use apache_log data in Kibana. Click on “Discover” from left side Menu and choose logstash* from the drop down and all the data from the log will be displayed here. If you are using the same log as mine, initially you will not be able to see any data. That’s because the filter field on the right corner of the page will default to time “last 15 minutes”. Since, this log is an old one, click on the time and choose “Quick ” and then select “last 5 years” option and bingo! the log data shows up on the screen.

If the above setting is not clear, please check the screenshot below

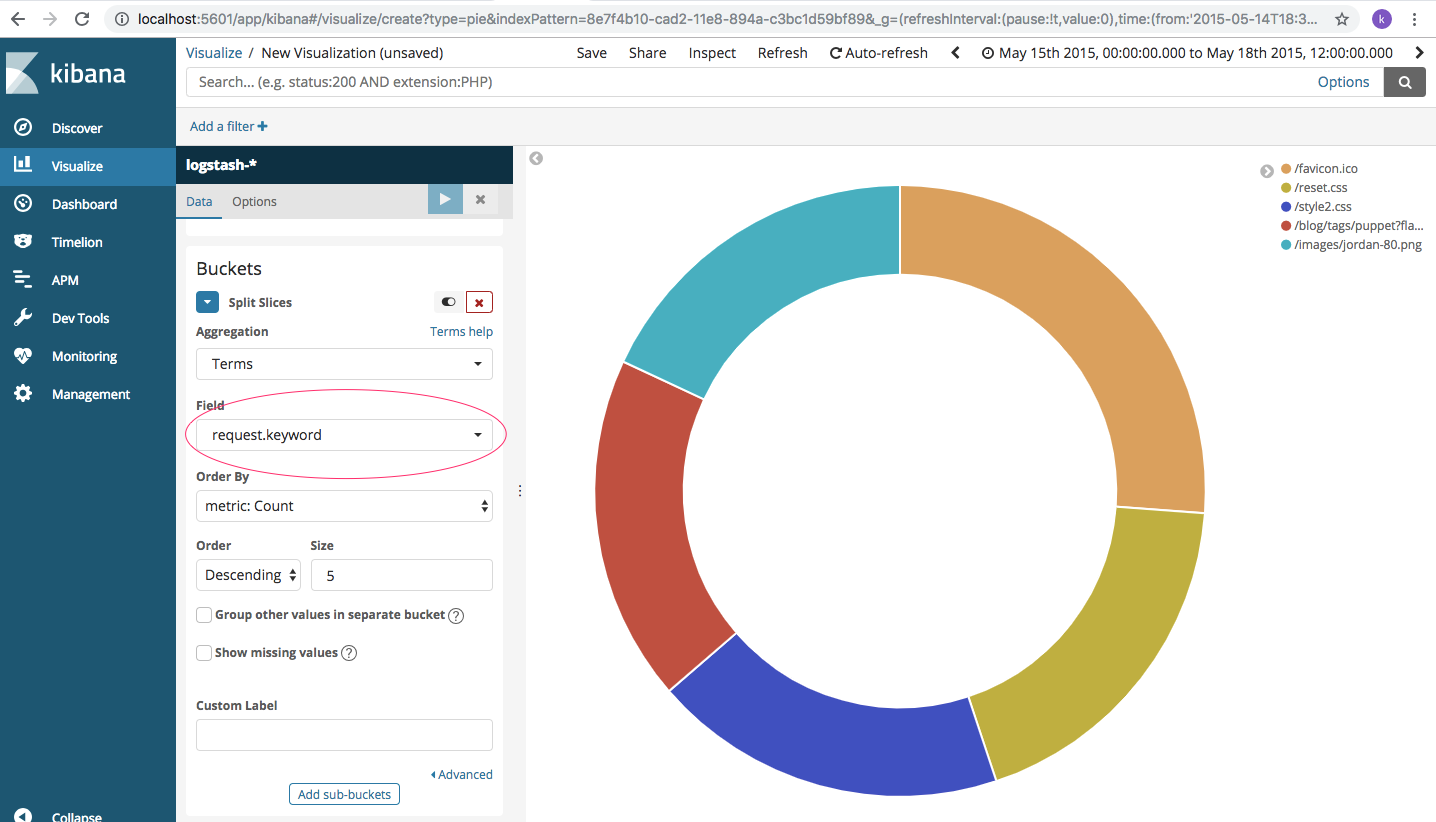
In case you need a refresher on Kibana visualizations, check this out. You can use Discoverer to get a pie-chart of the different requests coming in. So let’s say you want to analyze the various request keywords for your web server traffic. This visualization shows the various requests (aggregate by “Terms” and field is “request.keyword”) that hit the apache server.
How does it help? Well, for websites with huge volume of traffic, this helps understand the pattern of resource consumption. Common questions that we can answer:
- Is the new blog post garnering all the attention?
- Is it the new pair of shoes that are being seen so frequently?
- Are people interested in self help books or easy comedy?
Another use-case may be to analyze the HTTP response codes of the web server. We are pulling up the same pie-chart for the different response codes server has generated.
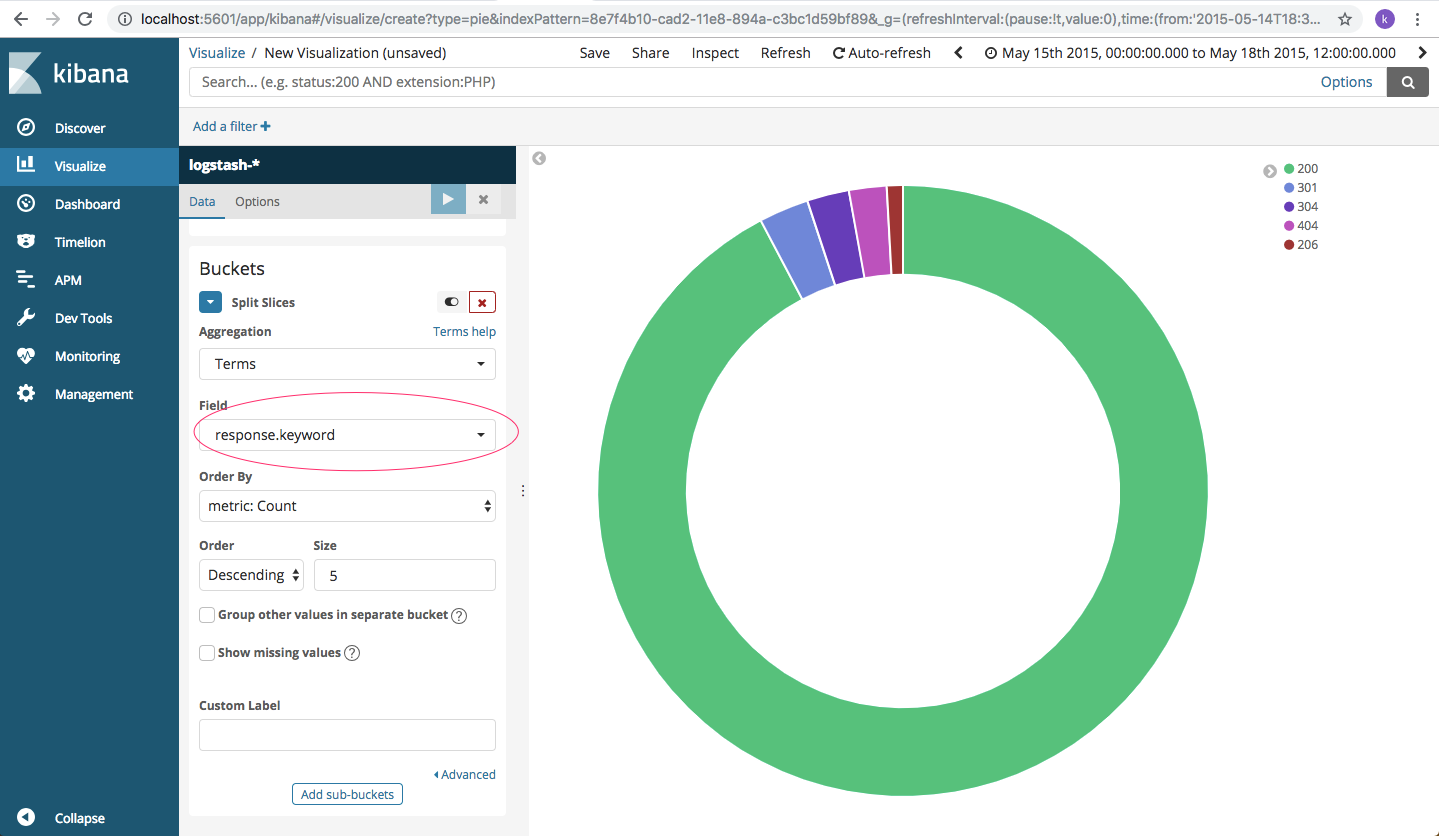
What do we infer from this visual? Well, is the web server able to provide a proper response as expected? Are we returning too many ‘page not found’ errors? Why do we have too many ‘authentication failed’ errors? Are a majority of users really forgetting their passwords or something malicious is going on?
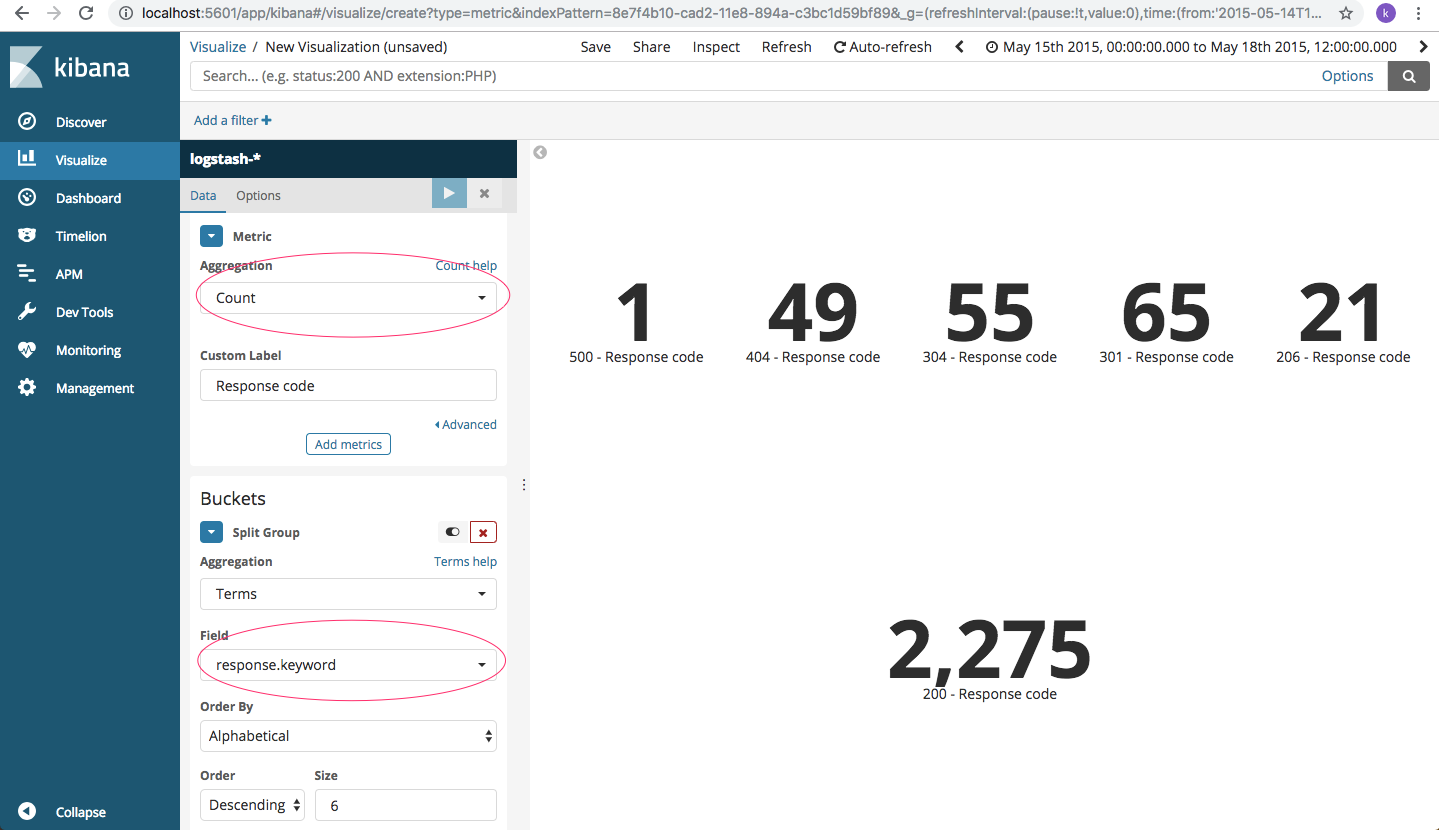
In addition, we can also create dashboard level metrics for error code like so.
For time-series analysis, we need to click on Visualise->Time series->Visual Builder. Here, the screen is divided in two horizontal planes. In the bottom plane, choose “Panel Options” tab and type the index pattern as “logstash*” and the time series will show up as a graph like so
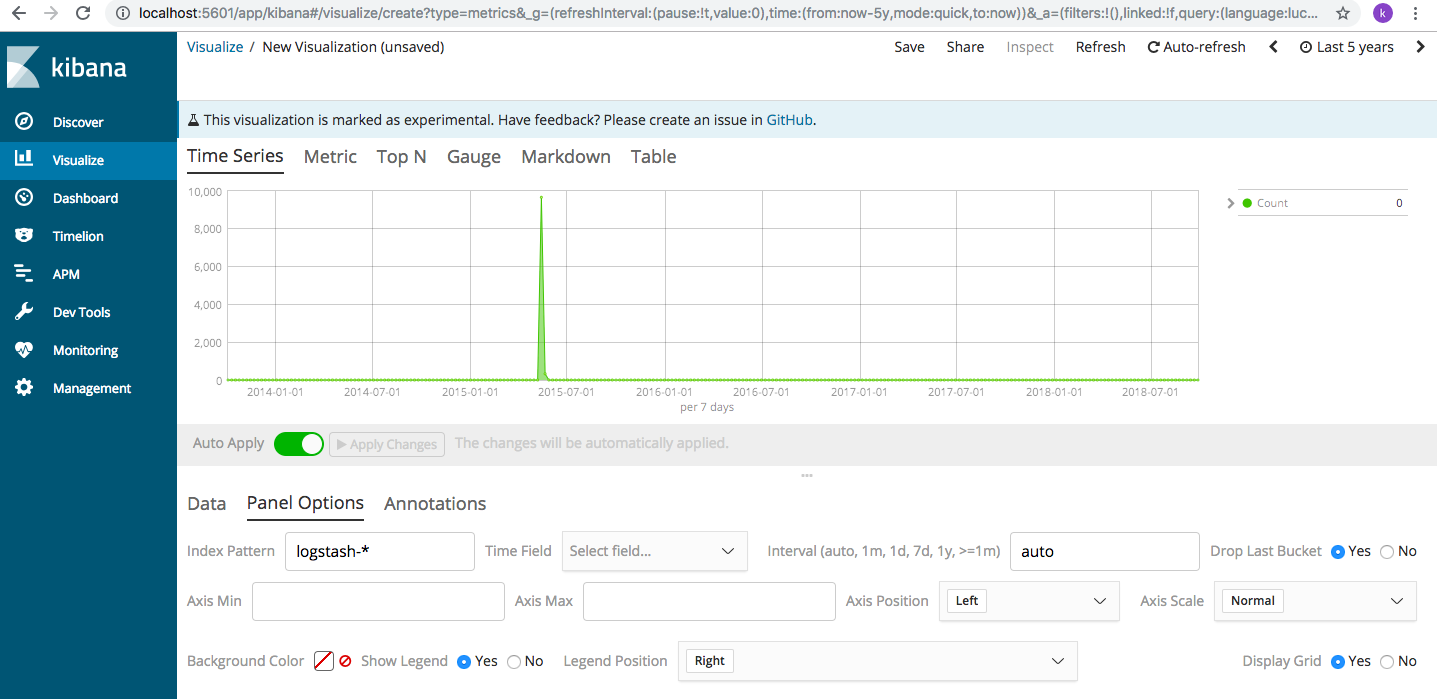
It shows the access rate for the given time period. Since, most of the log data is around the same time, let’s change the date (from Last 5 years) to around May 18, 2015 (we can change the date as below)

and the output changes like shown below. Here, the log data has been generated for every 5 times for the particular day selected.
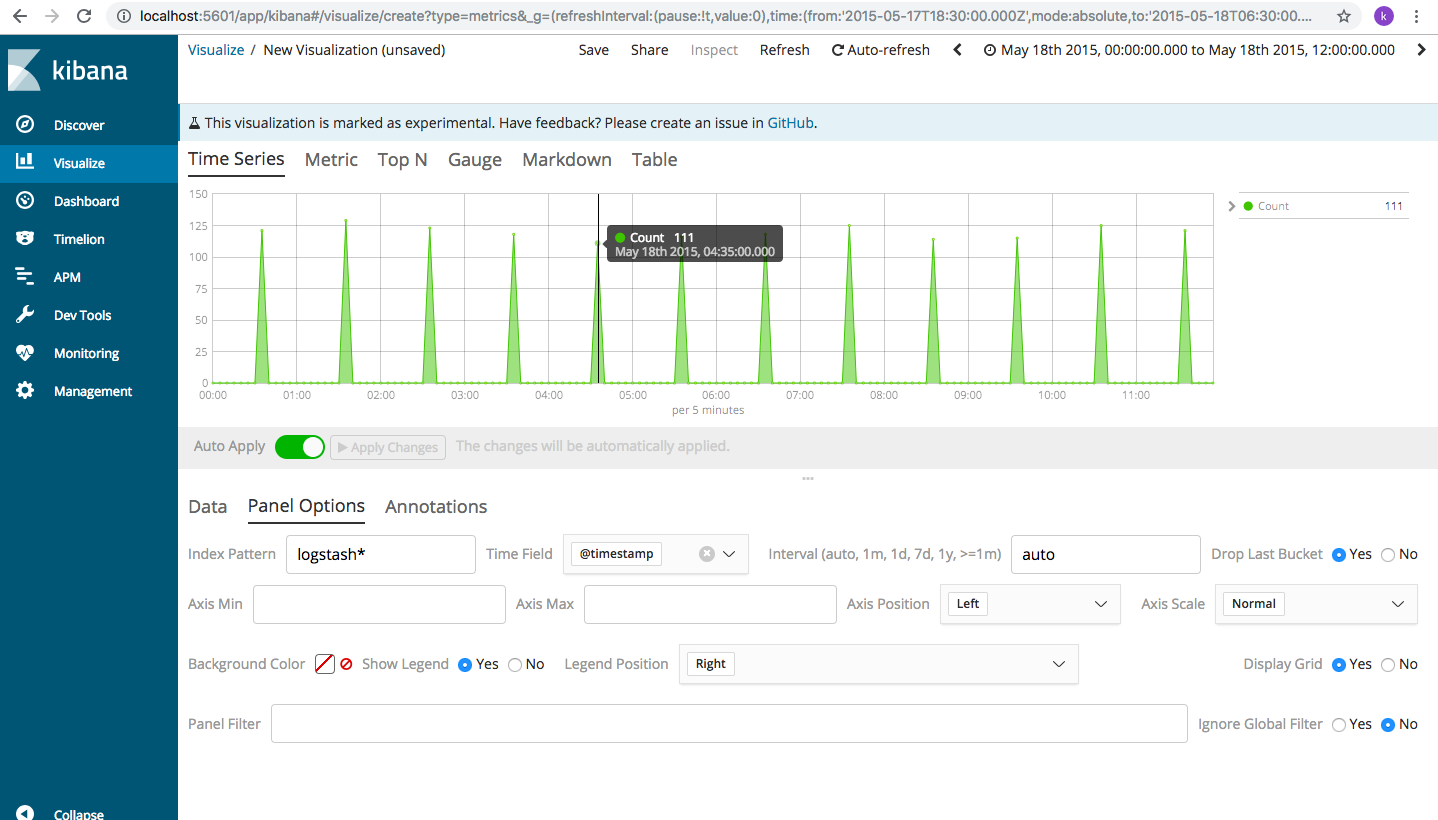
Let’s say this is an access log for an online shopping website and a lot of users have accessed this on May 18 2015. Why? Probably because the company has come up with certain discounts or launched a new product. If this data is considered in real time, we can visualize the number of people accessing the server currently. If its the festive season, and we are expecting a lot of traffic, we can also foresee when the servers will be stretched based on the historical pattern and act accordingly. It also helps in marketing and sales: a lot of people are currently logged in, should I add an additional 5% discount to amp up my sales immediately?
If it’s a banking institution that the system is designed for, we can ask questions such as: Why are so many users trying to access the system at same time? Are they really bonafide users or some malware trying to break into the server? By installing a few plugins, we can also visualize which geographic area the requests are originating from . So, we will even get to know if requests are being made from a certain place. These visualizations are really powerful and user friendly and one doesn’t need to have a lot of technical expertise to use Kibana.
That’s about it on this one. I hope the blog posts in this series on ELK stack have been useful for the interested folks to sharpen their data analytics and visualizations chops.
P.S. : some quick troubleshooting tips on Kibana index patterns:
What if the “create index pattern” page is displaying loading wheel indefinitely on clicking “create index pattern”?
Since Kibana opens in a webpage, we can use browser troubleshooting to see what’s wrong on our page. Right click on the page->Inspect->choose console tab. This shouldn’t show any errors, there can be log messages but not error. I had the forbidden error in red. On trying to refresh any index pattern, this error came up on screen Config: Error 403 Forbidden: blocked by: [FORBIDDEN/12/index read-only / allow delete (api)];
This implies, the indexes are all read-only and hence no changes are possible. This happens when kibana runs out of space on the server it’s installed on. We ran out of disk space and had to add more space. Kibana forces read-only on the indexes but does not get them back to normal state in an out-of-space situation. We had to manually move them out like so
curl -XPUT http://localhost:9200/_all/_settings -d '{"index.blocks.read_only_allow_delete": null}'
(localhost to be replaced by your server IP/name). On completing successfully, it displays {“acknowledged:true”} . You can refresh Kibana from the webpage and try and create the index patterns now.
Comments