
What is Filebeat?
Official documentation states that “Filebeat is a lightweight shipper for forwarding and centralizing log data. Installed as an agent on your servers, Filebeat monitors the log files or locations that you specify, collects log events and forwards them to either Elasticsearch or Logstash for indexing.
When you kickoff Filebeat, it starts one or more inputs that look in the locations you’ve specified for log data. For each log that Filebeat locates, Filebeat starts a harvester. Each harvester reads a single log for new content and sends the new log data to libbeat, which aggregates the events and sends the aggregated data to the output that you’ve configured for Filebeat. Here is a simple diagram to explain the working mechanism of Filebeat.”
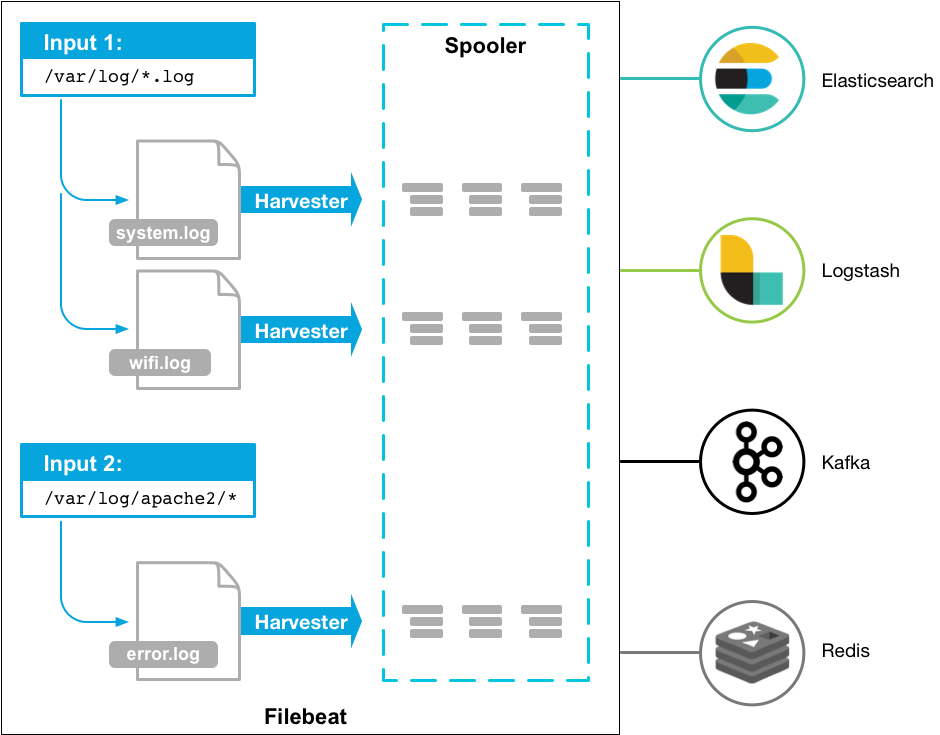 image taken from https://www.elastic.co/guide/en/beats/filebeat/current/filebeat-overview.html
What is a Harvester?
A harvester is responsible for reading the content of a single file. The harvester reads each file, line by line, and sends the content to the output. One harvester is started for each file. The harvester is responsible for opening and closing the file, which means that the file descriptor remains open while the harvester is running.
What is an Input?
An input is responsible for managing the harvesters and finding all sources to read from.
If the input type is log, the input finds all files on the drive that match the defined glob paths and starts a harvester for each file. Each input runs in its own Go routine.
You can read in detail from official documentation: https://www.elastic.co/guide/en/beats/filebeat/current/how-filebeat-works.html
Is Filebeat mandatory for analysing logs with Kibana-Elasticsearch?
Short answer – No. However, it is the recommended architecture to take load off Logstash and Elasticsearch in real time environment. We have already read log files using Logstash in an earlier post and analysed them using Kibana-Elasticsearch.
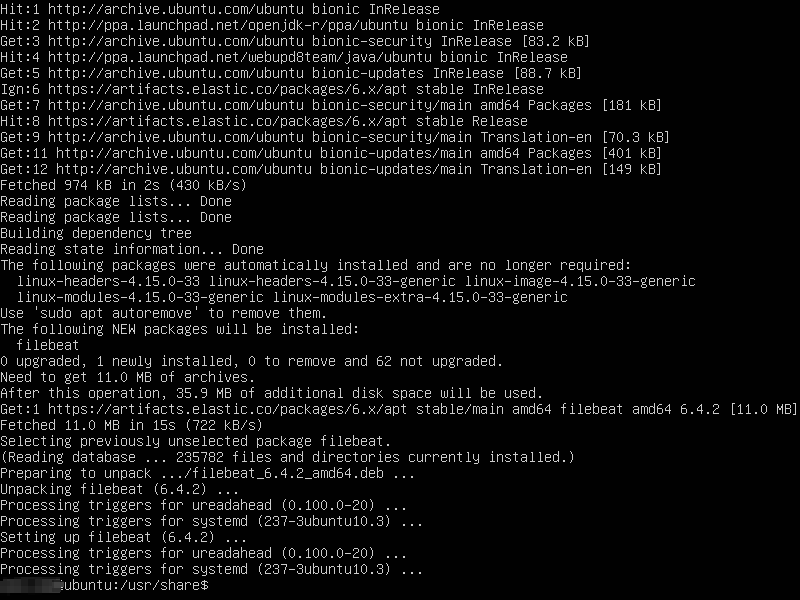
Let’s check the installation steps and go through a basic example of working with Filebeat-Kibana-Elasticsearch. Installing Filebeat is straight forward and single line, really.
$sudo apt-get update && sudo apt-get install filebeat
and Filebeat should install without fuss.
We had also discussed earlier that with few a plugins, we will be able to retrieve IP addresses of the users from the access logs. Let’s now install these plugins to unleash the potential of Kibana. These are Elasticsearch plugins and do not need filebeat for using them. We will use two of these plugins
- ingest-geoip: The GeoIP processor adds information about the geographical location of IP addresses, based on data from the Maxmind databases. This processor adds this information by default under the geoip field. Official link : https://www.elastic.co/guide/en/elasticsearch/plugins/master/ingest-geoip.html
- ingest-user-agent: The user_agent processor extracts details from the user agent string a browser sends with its web requests. This processor adds this information by default under the user_agent field. Official link: https://www.elastic.co/guide/en/elasticsearch/plugins/current/ingest-user-agent.html
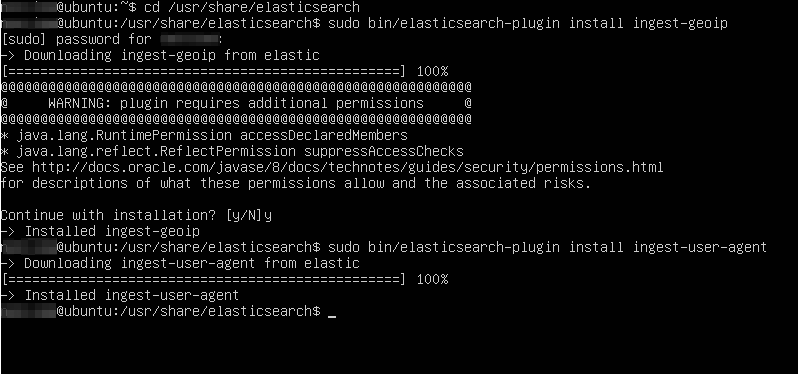
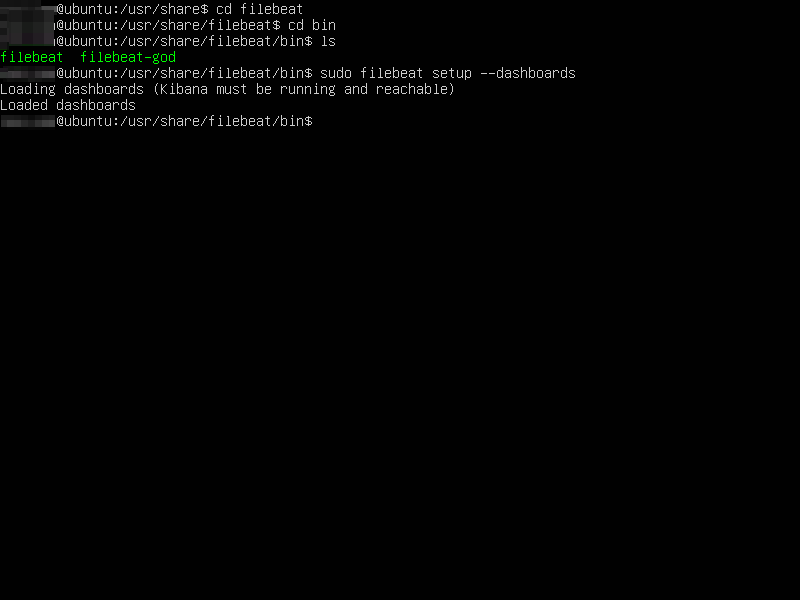
We will need to install them with Elasticsearch, so lets get to the home directory of Elasticsearch. We also need to refresh Elasticsearch to pick the new plugins installed. Filebeat has dashboards in kibana that we can install to unleash the power of Filebeat-kibana-Elasticsearch.
cd /usr/share/elasticsearch

$sudo /bin/elasticsearch-plugin install ingest-geoip

$sudo /bin/elasticsearch-plugin install ingest-user-agent

$sudo /bin/systemctl stop elasticsearch.service

$sudo /bin/systemctl start elasticsearch.service

$cd /usr/share/filebeat/bin

$sudo filebeat setup --dashboards
Reference output screens are shown below:
Filebeat installation already loads the module files for us. They are all in disabled state so that Filebeat won’t go about reading them during startup. We can enable the ones we want. Here, we are using the apache access log we downloaded in the earlier post. So, we will enable the apache.yml file and make necessary changes to read our access files.
$cd /etc/filebeat/modules.d
$ls (you will see .yml files for different modules in disabled state
$sudo mv apache2.yml.disabled apache2.yml (enabling yml for apache module, since our access logs are from apache)
Once enabled, we need to make few changes in the configuration file to read logs from home directory and log errors in the same directory. Of course, this is a configurable item and its upto you which directory to choose for logs and errors.
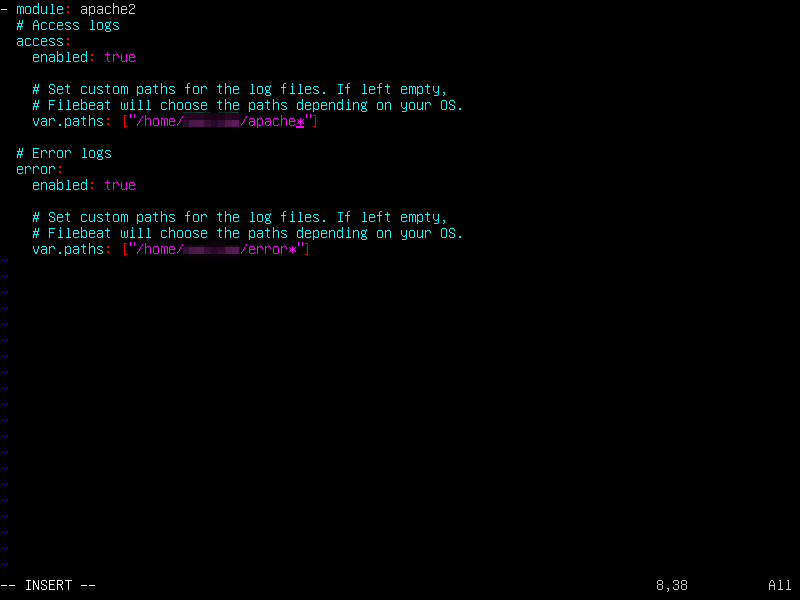
$sudo vi apache2.yml (press i to get into insert mode)
We need to uncomment and set path for var.paths : [“/home/<your name>/apache*”] in the “#Access logs” section. In our previous post we downloaded apache access log to our home directory and hence we are setting this path. Our file name was “apache_log” and hence we are giving “apache*” as the matching criteria for filename. Similarly, we will set var.paths : [“/home/<your name>/error*”] in the “Error logs section” as shown (press Esc+wq! to save the changes to the file and exit)
And we will start filebeat as:
$sudo /bin/systemctl start filebeat.service
If you now access the Elasticsearch indices http://localhost:9200/_cat/indices , you will see Filebeat index added to the existing list of indices.

Let’s now log into Kibana and create index pattern to access the data we just read into Elasticsearch using Filebeat. Log into Kibana using http://localhost:5601 . Navigate to Management->Index Patterns-> + Create Index Pattern. Type the name “filebeat” and Kibana will show the Indexes already present on the server, as below. 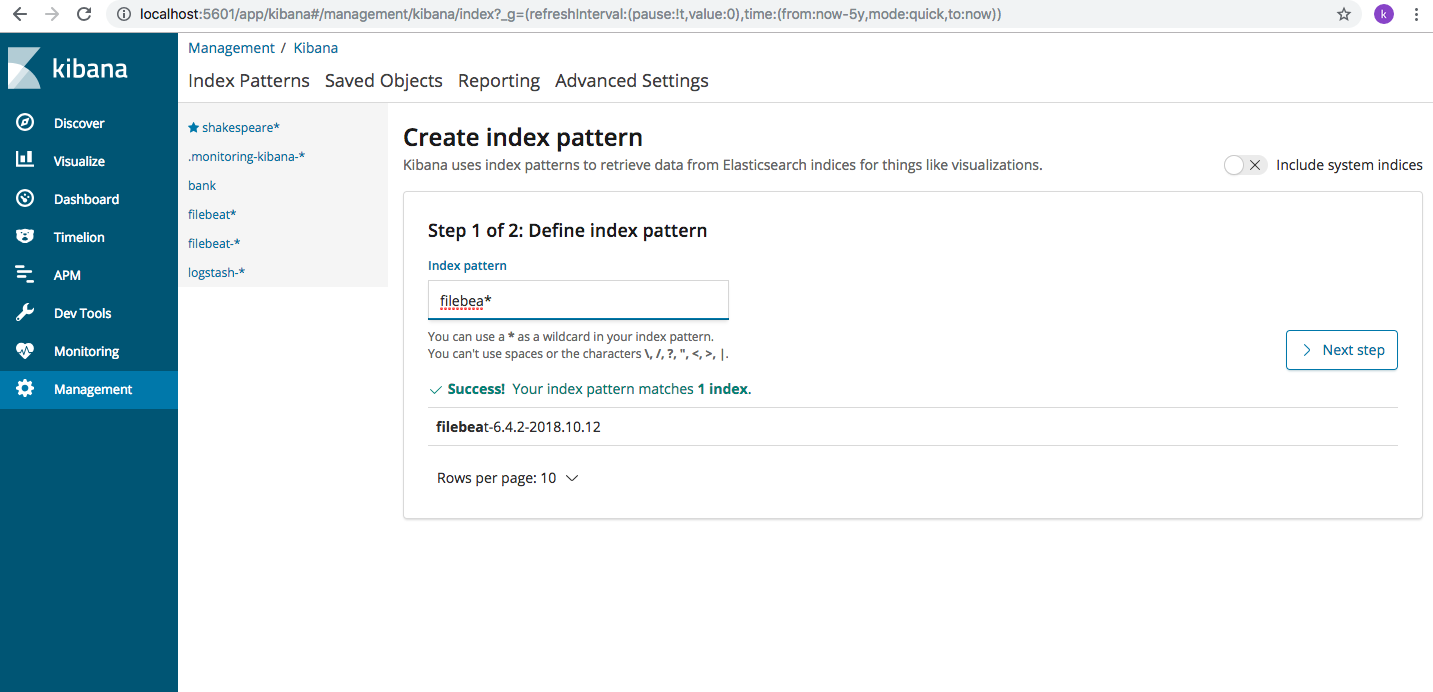
Follow the next steps and create the index pattern. You will come to this page where all the fields present are displayed
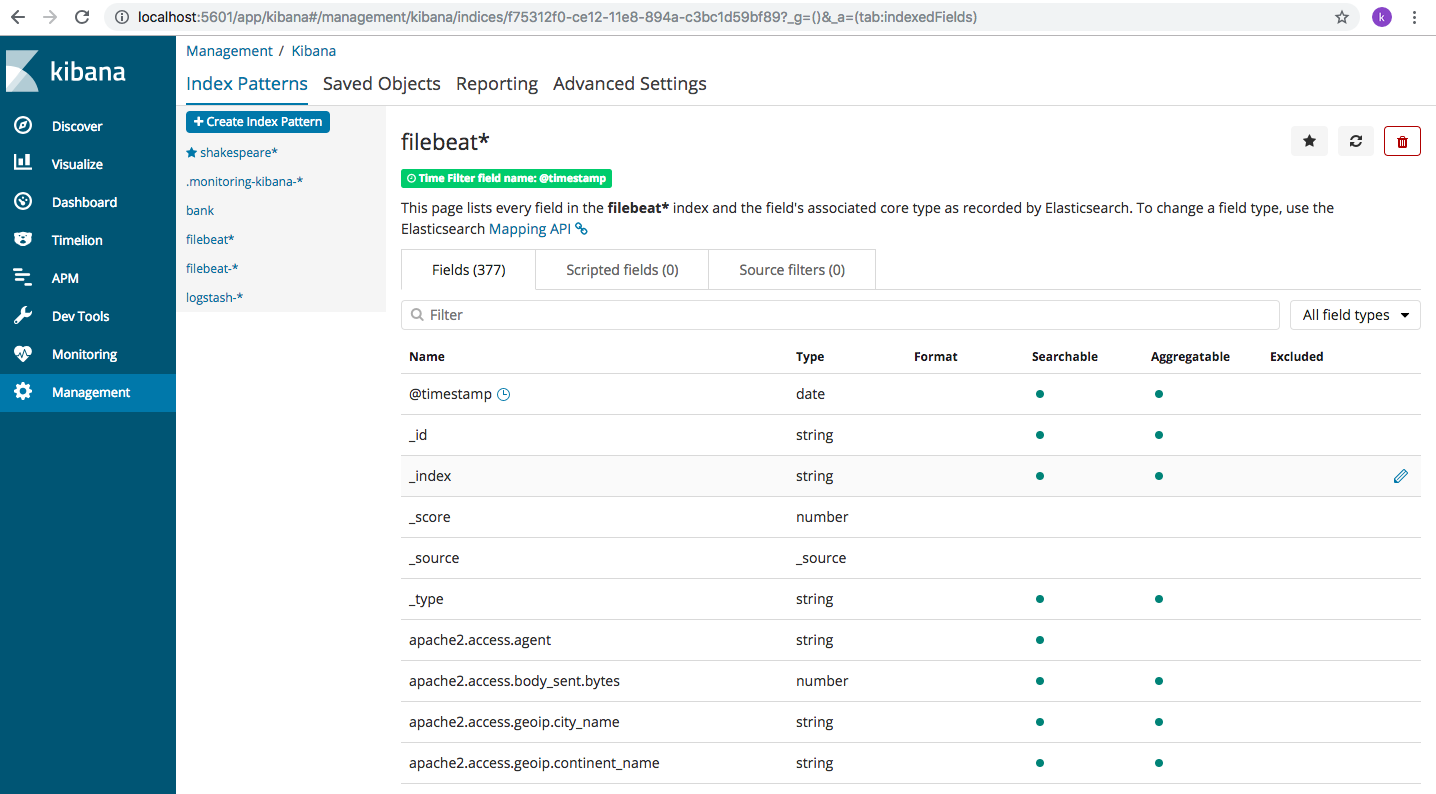
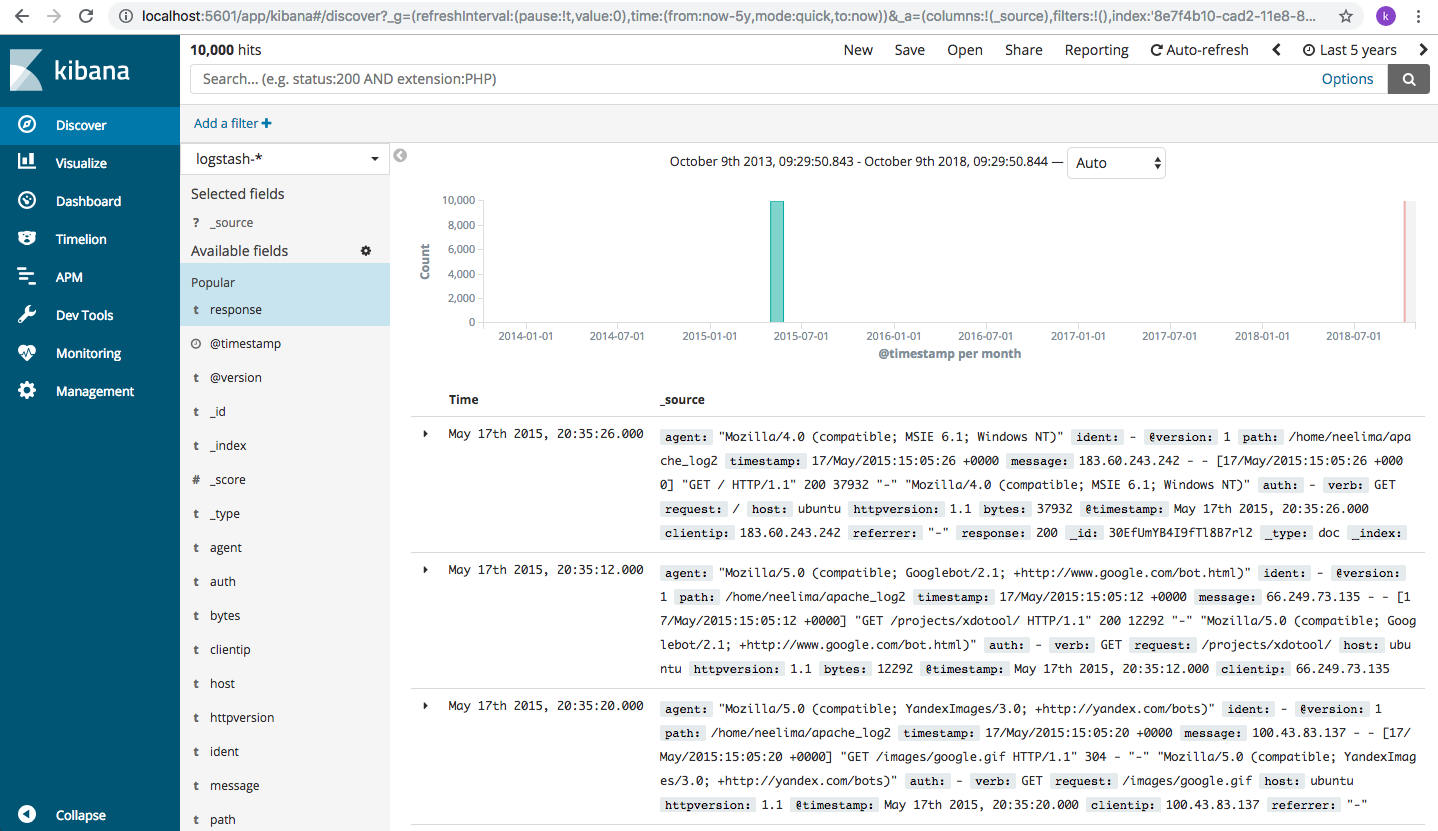
There are a lot of fields here, we can see geoip fields too have come in because of the geoip plugin we installed. Get familiar with the fields. Lets now navigate to “Discover” page and choose the “filebeat” index pattern from the drop down. And you will see a lot of data coming in. In case, the screen remains blank, change the date from right corner page. These all have been discussed in detail in the last post. Please refer to it in case of any issue.
Click on the “geoip” field and click on Visualise. Let’s analyse our data based on location and let’s see what we get

We will see something like this

That’s cool. We get to see the number of requests coming from each region. We can choose country wise selection or IP wise and drill down the data for analysis.
While installing Filebeat, we also installed Kibana dashboards. Let’s see what the dashboard offers. From left side menu, choose “Dashboard” (this menu option got added after we installed dashboards from command line).
Initially when dashboard is blank, click on “create new dashboard” -> “add” and a lot of default options open up.

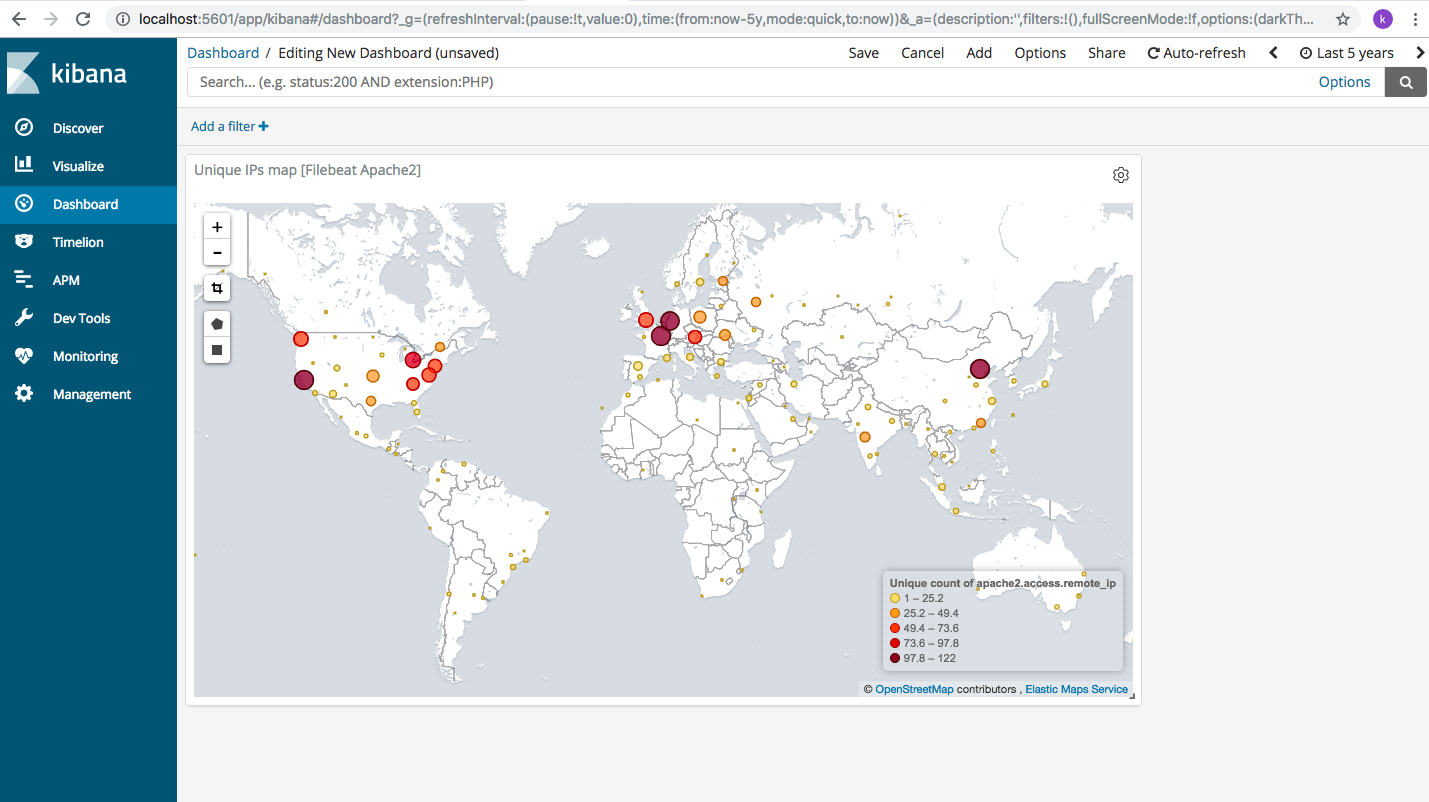
Here we choose “Unique IPs map [Filebeat Apache2]” and the output is as shown below. There are a lot of options to choose from and they help us visualize the data we have in our access logs.
We can even choose some of the existing ones:

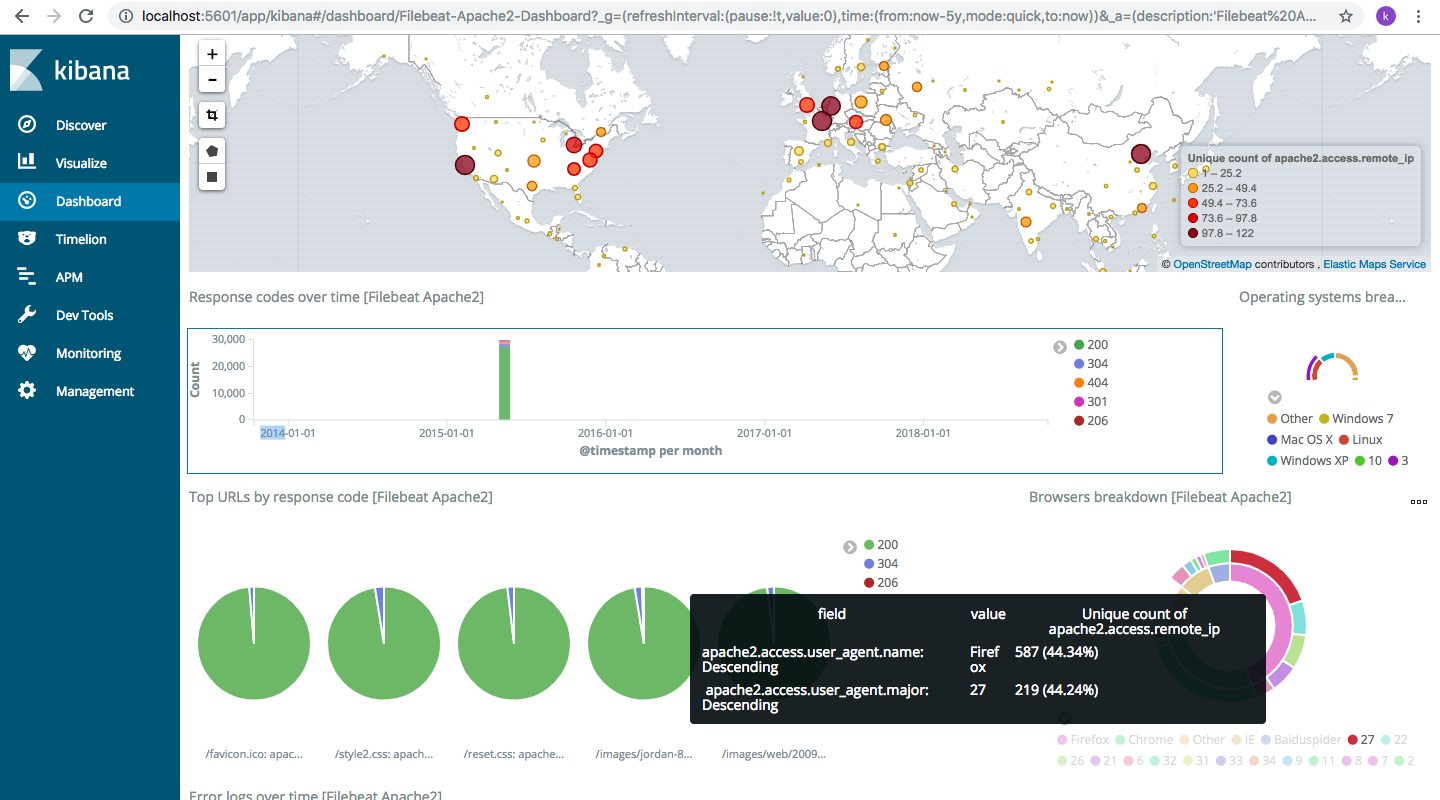
I have chosen “[Filebeat Apache2] Access and error logs” and we can see something like this

Anything you point at in the screen will show data and help us to drill now. I pointed at “Browsers breakdown [Filebeat Apache2” data and it shows as:
That’s it for now. Play around and enjoy the powerful analytics features that Filebeat-Kibana offers.
Comments