
In the previous blog post, we gave a bird’s eye introduction to Elasticsearch, which is a highly scalable open-source full-text search and analytics engine. But, everyone does not get a kick out of typing commands for querying data using Elasticsearch. Is there another way around?
What is Kibana? Why is it required when I already have Elasticsearch?
Well, as they say – a picture is worth a thousand words. We have an open source analytics and visualization platform called Kibana that plays nice with Elasticsearch. Additionally, setting up Kibana is easy and you can access the underlying data without having to write a single line of code. Also, Kibana uses web browser as its interface, so you do not need to install any tools for accessing Kibana.
Let’s get started with Kibana and you will see how easy it is to set it up.
Installing Kibana and troubleshooting
Command for installing Kibana on the same server as Elasticsearch:
$sudo apt-get install kibana

Once kibana installs, we change the host entry as in elasticsearch to open it for access from anywhere. This should not be done for production systems. Type the following:
$sudo vi /etc/kibana/kibana.yml
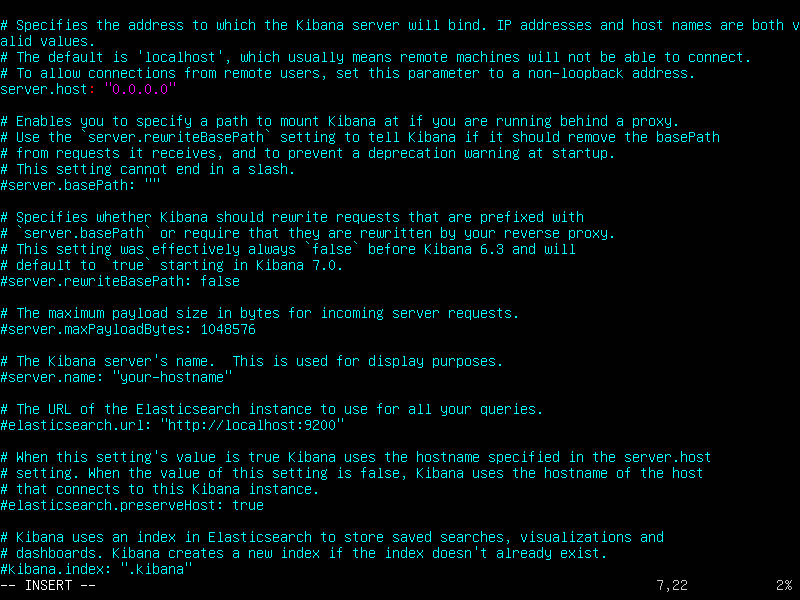
Use arrow keys to move down the file. We need to change the following line to open access from anywhere (again, this configuration should not be used on production systems).
Server.host : “localhost” this needs to changed to server.host : “0.0.0.0”
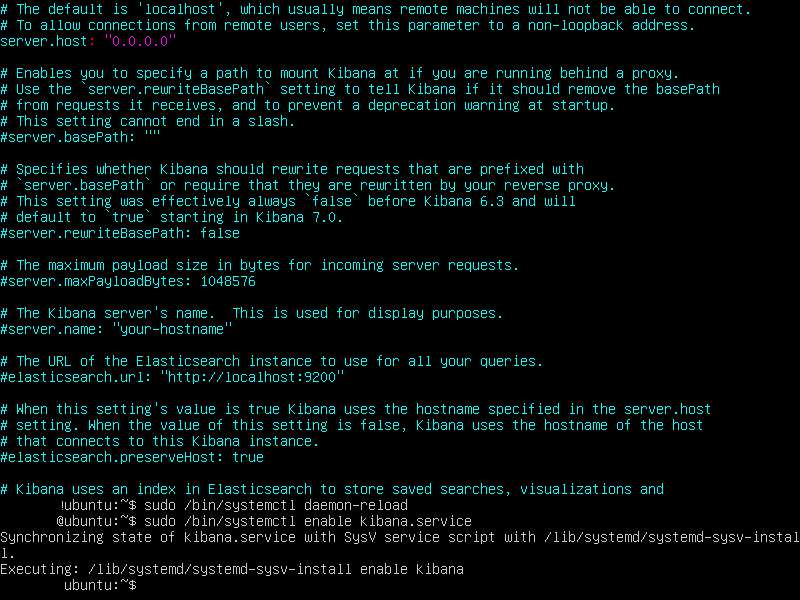
Now, we will add kibana to the daemon services, so it starts automatically on system startup
$sudo /bin/systemctl daemon-reload

$sudo /bin/systemctl enable kibana.service

$sudo /bin/systemctl start kibana.service
We have now started the service, we can access kibana from web browser by typing 127.0.0.1:5601 (kibana runs on port 5601). If everything goes fine, you will see the kibana home page

Troubleshooting:
What if kibana home page doesn’t open up as shown above, but you get a page with a “cannot be displayed” error!
In that case, first we need to check if kibana is up and running. To do this, type the following command
$netstat -a -n | grep tcp | grep 5601
You will see something like so (Kibana is up and running on the port 5601. LISTEN implies, it is listening for incoming requests and ready to process them)
![]()
What if nothing comes up? It means, kibana service has not started for some reason. One way to check for the underlying cause :
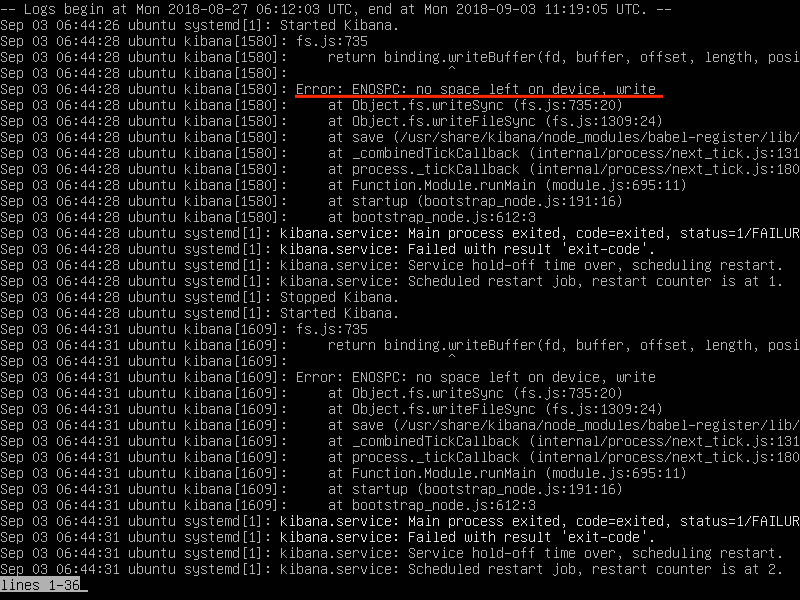
$journalctl -u kibana.service
journalctl Linux command is used to query the contents of journal written by Linux service manager. Earlier, we started Kibana as a service (using command ‘systemctl start kibana.service’ ) and hence the logging data can be retrieved using journalctl.
You will see a log similar to the one below. As you see, kibana has logged its activity here and we can read through the log to figure out what went wrong with the service we started. In this case, kibana did not start since device seems to be running out of space.
 The above command might output a lot of information which might not even be of recent attempted runs of kibana. To check what has been logged for the most recent run, the following command can be used
$journalctl -u kibana.service --since today
To display a set number of lines(n) you can use the syntax below (we are displaying last 20 lines)
$journalctl -n 20
Coming to the issue – one way to deal with space scarcity is to check for archives data that fills up quite fast on the server if left unchecked. Type the following at the prompt
$sudo du -sh /var/cache/apt/archives

Output will be something similar to as shown above (496M is the space occupied). I have cleared my archives with the command below and as you see, the updated occupied space is only 16k now).
If the space occupied is quite high, you can clear them using
$sudo apt-get clean
Sometimes logs (that we check through journalctl command) also take up a lot of space. Run the following command to check the space used
$journalctl --disk-usage
![]()
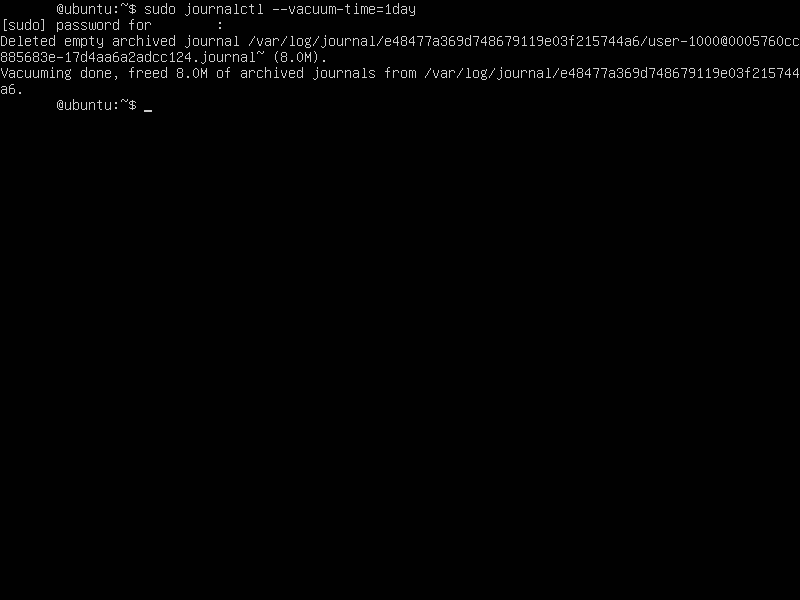
If you wish to clear them, the following command can be used (to clear all logs except for last 1 day. You can give 1 year if you wish to retain all year old logs and so on, based on your requirement)
$sudo journalctl --vacuum-time=1day
Now rerun the above command to check the updated space occupied by archives.
You can try restarting kibana as shown below and see if it works:
$sudo /bin/systemctl restart kibana
To check status of kibana you can use:
$sudo /bin/systemctl status kibana.service
As we are using Virtualbox to run Ubuntu and kibana didn’t start even after clearing archives, we had to allocate more device space and I have outlined the steps as shown below.
Before making any changes to device space , please logout of ubuntu and then the virtualBox. We need the exact location of the virtual box space.
Goto VirtualBox -> ubuntu ->settings->storage->select vdi as shown below from left panel.

Copy everything it shows in the location and exit out of VirtualBox.
Now, open terminal and type the following
(The actual Syntax of the command is
sudo VBoxManage modifyhd “location_where_disk_is” -resize “to new size in MBs”)
$sudo VBoxManage modifyhd /Users/<my_name>/VirtualBox\ VMs/ubuntu-elastic/ubuntu-elastic.vdi –resize 25600
This will increase the disk size to the new size. Once this completes successfully, repeat steps above for restarting the services and check if they have run successfully.
That’s it folks, look forward to your comments or questions on Kibana.
Comments